Housing Market Updates

What’s Causing Ongoing Home Price Appreciation?

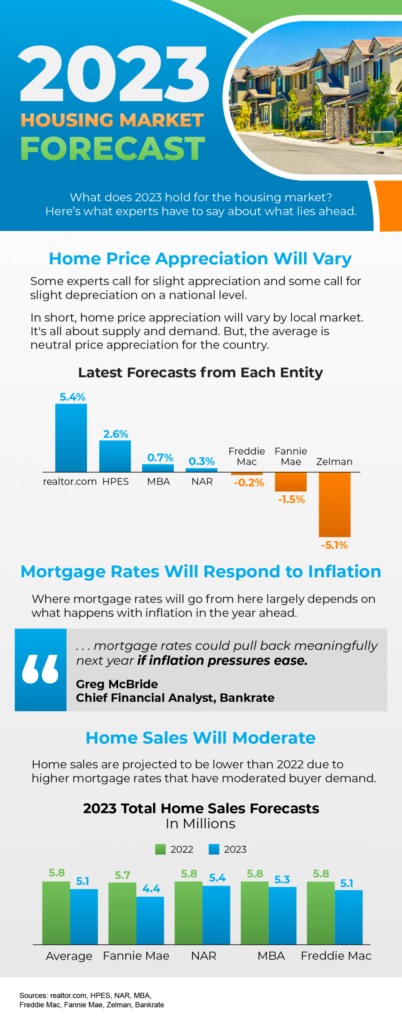
What’s Causing Ongoing Home Price Appreciation?   If you’re thinking about making a move, you probably want to know what’s going to happen to home prices for the rest of the year. While experts say price growth will moderate due to the shifting market, ongoing appreciation is expected. That means home prices won’t fall. Here’s a look at two key reasons experts forecast continued price growth: supply and demand. While Growing, Housing Supply Is Still Low Even though inventory is increasing this year as the market moderates, supply is still low. The graph below helps tell the story of why there still aren’t enough homes on the market today. It uses data from the Census to show the number of single-family homes that were built in this country going all the way back to the 1970s. The blue bars represent the years leading up to the housing crisis in 2008. As the graph shows, right before the crash, homebuilding increased significantly. That’s because buyer demand was so high due to loose lending standards that enabled more people to qualify for a home loan. The resulting oversupply of homes for sale led to prices dropping during the crash and some builders leaving the industry or closing their businesses – and that led to a long period of underbuilding of new homes. And even as more new homes are constructed this year and in the years ahead, this isn’t something that can be resolved overnight. It’ll take time to build enough homes to meet the deficit of underbuilding that took place over the past 14 years. Millennials Will Create Sustained Buyer Demand Moving Forward The frenzy the market saw during the pandemic is because there was more demand than homes for sale. That drove home prices up as buyers competed with one another for available homes. And while buyer demand has moderated today in response to higher mortgage rates, data tells us demand will continue to be driven by the large generation of millennials aging into their peak homebuying years (see graph below): Odeta Kushi, Deputy Chief Economist at First American, explains:  “. . . millennials continue to transition to their prime home-buying age and will remain the driving force in potential homeownership demand in the years ahead.” That combination of millennial demand and low housing supply continues to put upward pressure on home prices. As Bankrate says: “After all, supplies of homes for sale remain near record lows. And while a jump in mortgage rates has dampened demand somewhat, demand still outpaces supply, thanks to a combination of little new construction and strong household formation by large numbers of millennials.” What This Means for Home Prices If you’re worried home values will fall, rest assured that experts forecast ongoing home price appreciation thanks to the lingering imbalance of supply and demand. That means home prices won’t decline. Bottom Line Based on today’s factors driving supply and demand, experts project home price appreciation will continue. It’ll just happen at a more moderate pace as the housing market continues its shift back toward pre-pandemic levels.

Expert Housing Market Forecasts for the Second Half of the Year

Expert Housing Market Forecasts for the Second Half of the Year

Expert Housing Market Forecasts for the Second Half of the Year The housing market is at a turning point, and if you’re thinking of buying or selling a home, that may leave you wondering: is it still a good time to buy a home? Should I make a move this year? To help answer those questions, let’s turn to the experts for projections on what the second half of the year...

What Does the Rest of the Year Hold for the Housing Market?

What Does the Rest of the Year Hold for the Housing Market?

What Does the Rest of the Year Hold for the Housing Market?   If you’re thinking of buying or selling a house, you’re at an exciting decision point. And anytime you make a big decision like that, one thing you should always consider is timing. So, what does the rest of the year hold for the housing market? Here’s what experts have to say. The Number of Homes...

Why Home Loans Today Aren’t What They Were in the Past

Why Home Loans Today Aren’t What They Were in the Past   In today’s housing market, many are beginning to wonder if we’re returning to the riskier lending habits and borrowing options that led to the housing crash 15 years ago. Let’s ease those concerns. Several times a year, the Mortgage Bankers Association (MBA) releases an index titled the Mortgage Credit Availability Index (MCAI). According to their website: “The MCAI provides the only standardized quantitative index that is solely focused on mortgage credit. The MCAI is . . . a summary measure which indicates the availability of mortgage credit at a point in time.” Basically, the index determines how easy it is to get a mortgage. The higher the index, the more available mortgage credit becomes. Here’s a graph of the MCAI dating back to 2004, when the data first became available: As the graph shows, the index stood at about 400 in 2004. Mortgage credit became more available as the housing market heated up, and then the index passed 850 in 2006. When the real estate market crashed, so did the MCAI as mortgage money became almost impossible to secure. Thankfully, lending standards have eased somewhat since then, but the index is still low. In April, the index was at 121, which is about one-seventh of what it was in 2006. Why Did the Index Get out of Control During the Housing Bubble? The main reason was the availability of loans with extremely weak lending standards. To keep up with demand in 2006, many mortgage lenders offered loans that put little emphasis on the eligibility of the borrower. Lenders were approving loans without always going through a verification process to confirm if the borrower would likely be able to repay the loan. An example of the relaxed lending standards leading up to the housing crash is the FICO® credit score associated with a loan. What’s a FICO® score? The website myFICO explains: “A credit score tells lenders about your creditworthiness (how likely you are to pay back a loan based on your credit history). It is calculated using the information in your credit reports. FICO® Scores are the standard for credit scores—used by 90% of top lenders.” During the housing boom, many mortgages were written for borrowers with a FICO score under 620. While there are still some loan programs that allow for a 620 score, today’s lending standards are much tighter. Lending institutions overall are much more attentive about measuring risk when approving loans. According to the latest Household Debt and Credit Report from the New York Federal Reserve, the median credit score on all mortgage loans originated in the first quarter of 2022 was 776. The graph below shows the billions of dollars in mortgage money given annually to borrowers with a credit score under 620. In 2006, buyers with a score under 620 received $376 billion dollars in loans. In 2021, that number was only $80 billion, and it’s only $20 billion in the first quarter of 2022. Bottom Line In 2006, lending standards were much more relaxed with little evaluation done to measure a borrower’s potential to repay their loan. Today, standards are tighter, and the risk is reduced for both lenders and borrowers. These are two very different housing markets, and today is nothing like the last time.

What Everyone Wants To Know: Will Home Prices Decline in 2022?

What Everyone Wants To Know: Will Home Prices Decline in 2022?

What Everyone Wants To Know: Will Home Prices Decline in 2022? If you’re thinking of buying a home in today’s housing market, you may be wondering how strong your investment will be. You might be asking yourself: if I buy a home now, will it lose value? Or will it continue to appreciate going forward? The good news is, according to the experts, home prices are not projected to decline....

5 Reasons Today’s Housing Market Is Anything but Normal

5 Reasons Today’s Housing Market Is Anything but Normal There are many headlines out there that claim we’re reverting to a more normal real estate market. That would indicate the housing market is returning to the pre-pandemic numbers we saw from 2015-2019. But that’s not happening. The market is still extremely vibrant as demand is still strong even while housing supply is slowly returning. Here’s the definition of normal from the Merriam-Webster Dictionary: “conforming to a type, standard, or regular pattern: characterized by that which is considered usual, typical, or routine.” Using this definition, here are five housing industry metrics that prove we’re nowhere near normal. 1. Mortgage Rates If we look at the 30-year mortgage rate chronicled by Freddie Mac, we can see the average rates by decade: 1970s: 8.86% 1980s: 12.7% 1990s: 8.12% 2000s: 6.29% 2010s: 4.09% Today, the average mortgage rate stands at 2.87%, which is very close to the historic low. Currently, mortgage rates are anything but usual, typical, or routine. 2. Home Price Appreciation According to Black Knight, a housing data and analytics company, the average annual appreciation on residential real estate prices since 1995 has been 4.14%. According to the latest forecast from the National Association of Realtors (NAR), home price appreciation will hit 14.1% this year, which will be greater than any year since Black Knight began collecting this data. Currently, home price appreciation is anything but usual, typical, or routine. 3. Months’ Supply of Inventory (Homes for Sale) According to NAR: “Months’ supply refers to the number of months it would take for the current inventory of homes on the market to sell given the current sales pace. Historically, six months of supply is associated with moderate price appreciation, and a lower level of months’ supply tends to push prices up more rapidly.” As of the latest Existing Homes Sales Report from NAR, the current months’ supply of inventory stands at 2.6. That’s less than half of a normal supply. Currently, the supply of homes for sale is anything but usual, typical, or routine. 4. Days It Takes To Sell a Home The days-on-market metric gives an indication of how hot a market is and how quickly homes are selling. In 2019, prior to the pandemic, the average days on market stood at 35, according to NAR. Today, that number is cut in half and is now at 17 days. Currently, the days-on-market metric is anything but usual, typical, or routine. 5. Number of Offers per Listing According to NAR, the number of offers per listing stood at 2.2 in 2019. Today, that number is double at 4.5. Currently, the number of offers per listing is anything but usual, typical, or routine. Bottom Line When… Mortgage rates are near historic lows Price appreciation is at historic highs Housing inventory is less than half of the normal amount The time it takes to sell a home is cut in half, and There are twice as many offers on each house …it’s hard to say we’re in a normal market.

Compare listings

Compare