By Mike Lentz | The Mike Lentz Team – Keller Williams Realty
The relationship between home prices and inventory explains why some areas see price growth while others flatten or dip. When inventory is low, buyers compete over fewer homes and prices rise. When inventory climbs back to normal levels, competition eases and prices level off. This dynamic is playing out across South Jersey and the nation right now, making your local market conditions more important than ever.
You’ve probably heard that home prices are cooling off nationally. But zoom in on individual markets across the country, and the picture looks completely different depending on where you are. The relationship between home prices and inventory is the key to understanding why some neighborhoods are booming while others have stalled.
Some areas are still seeing solid price growth. Others have gone flat. A few have actually dipped slightly negative. So what’s causing all of that variation?
Home Prices and Inventory: The Core Connection
Here’s the simple version:
- When there are more homes for sale, buyers have options.
- More options means less competition.
- Less competition means sellers can’t push prices as high.
On the flip side, when inventory is tight, buyers are competing over a small pool of homes, and that pushes prices up.
That dynamic is playing out right now in a really visible way across the country.
Markets where inventory has climbed back to or above normal pre-pandemic levels are seeing prices flatten or fall slightly. Markets where inventory is still well below those 2019 benchmarks are still seeing prices rise. As Lance Lambert, CEO of ResiClub, puts it:
“Home prices are still climbing a little year-over-year in many regions where active inventory remains well below pre-pandemic 2019 levels, such as pockets of the Northeast and Midwest.
In contrast, some pockets in states like Texas, Florida, and Colorado – where active inventory exceeds pre-pandemic 2019 levels by a solid clip – are seeing modest home price pullbacks or flat pricing.”
How Home Prices and Inventory Patterns Show Up on the Map
Take a look at where inventory stands today compared to 2019. In most places, inventory still falls short of where we were back then. And that’s exactly why prices are climbing, albeit moderately, in the vast majority of states.
But you’re probably more interested in where prices are falling a bit, since that’s what is making headlines. So let’s prove out how much inventory affects prices in those spots.
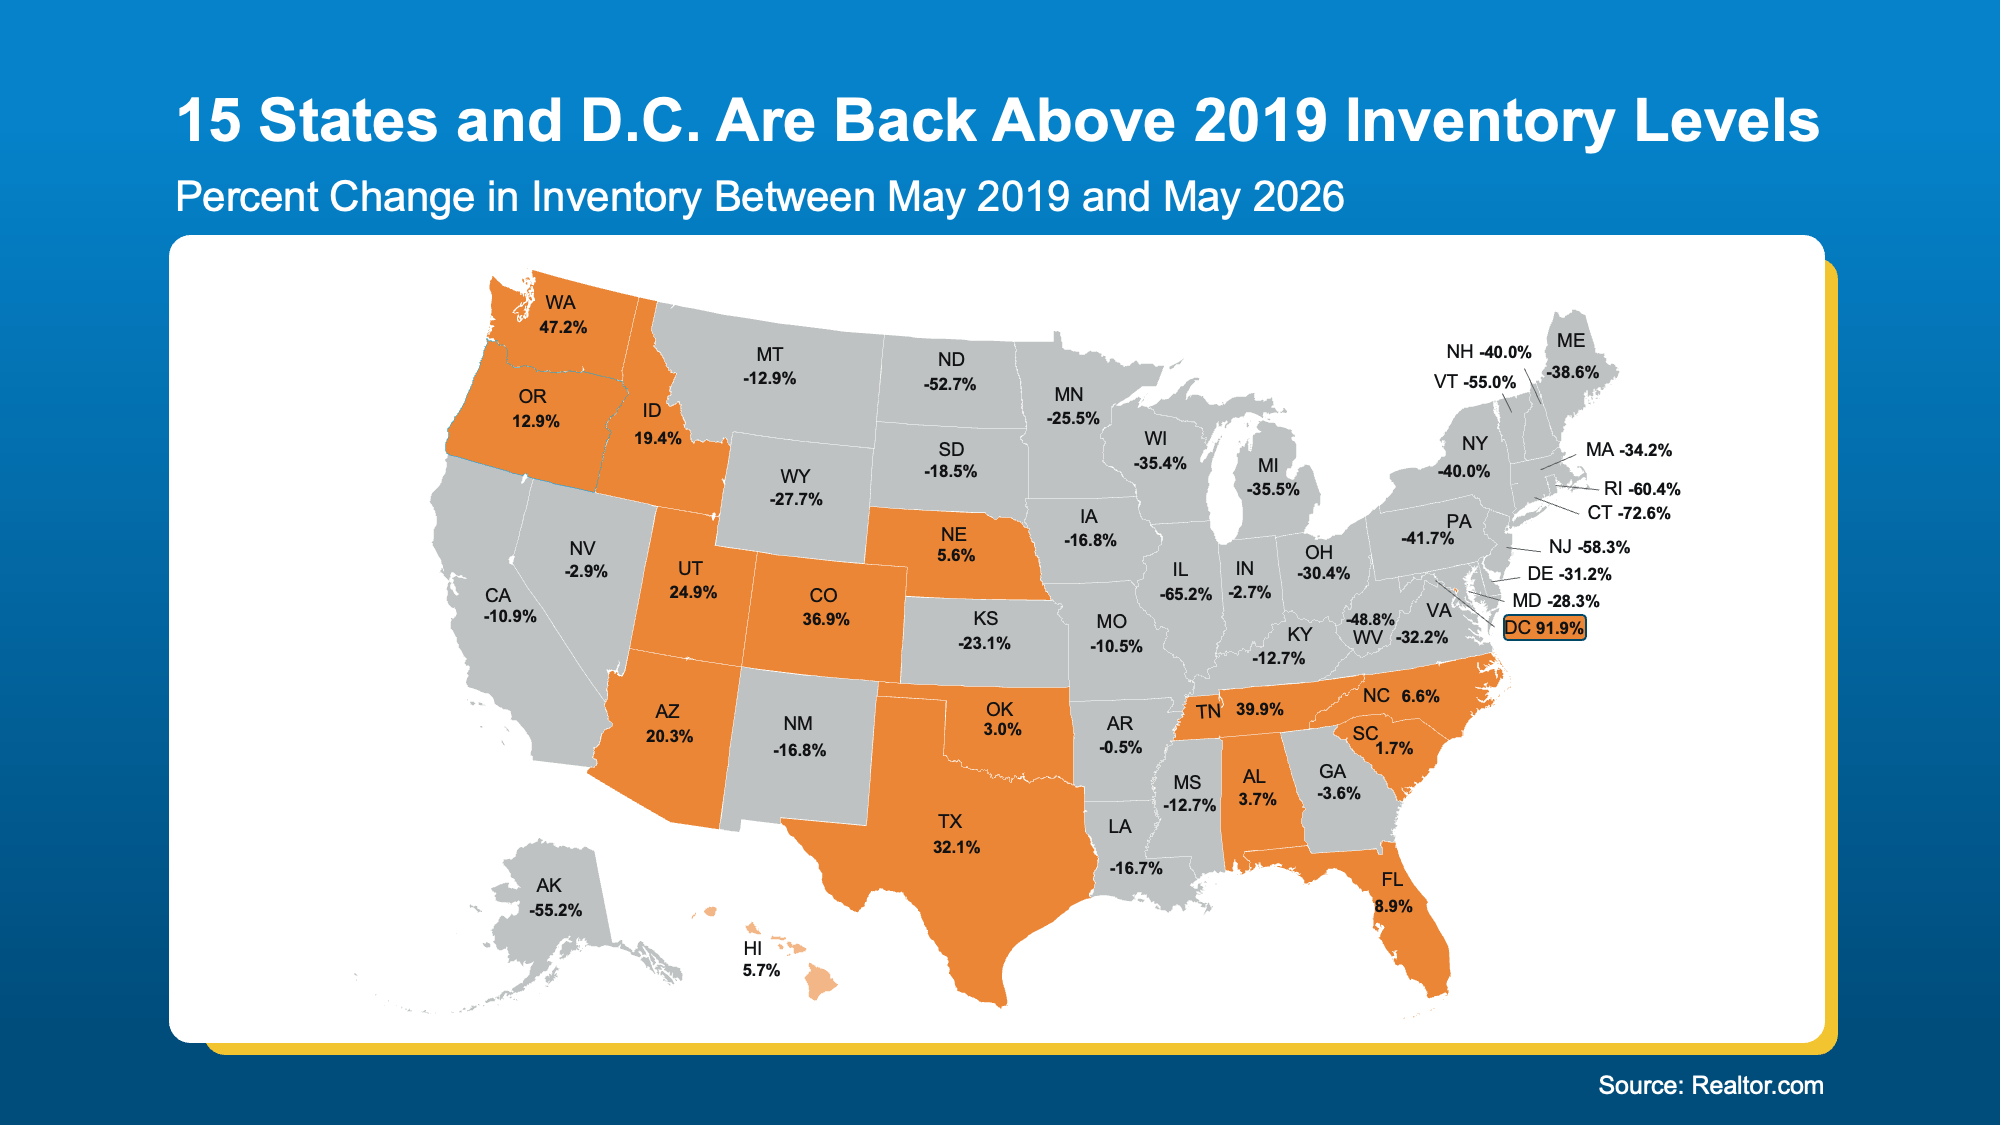
According to Realtor.com, 15 states and Washington, D.C. are now back above pre-pandemic inventory levels, and some by a wide margin:
Now let’s look at the latest Federal Housing Finance Agency (FHFA) data to see what’s happened to home prices in those same states over the past year.
See how those line up pretty closely with the areas seeing more homes for sale today?
The overlap isn’t a coincidence. It’s cause and effect.
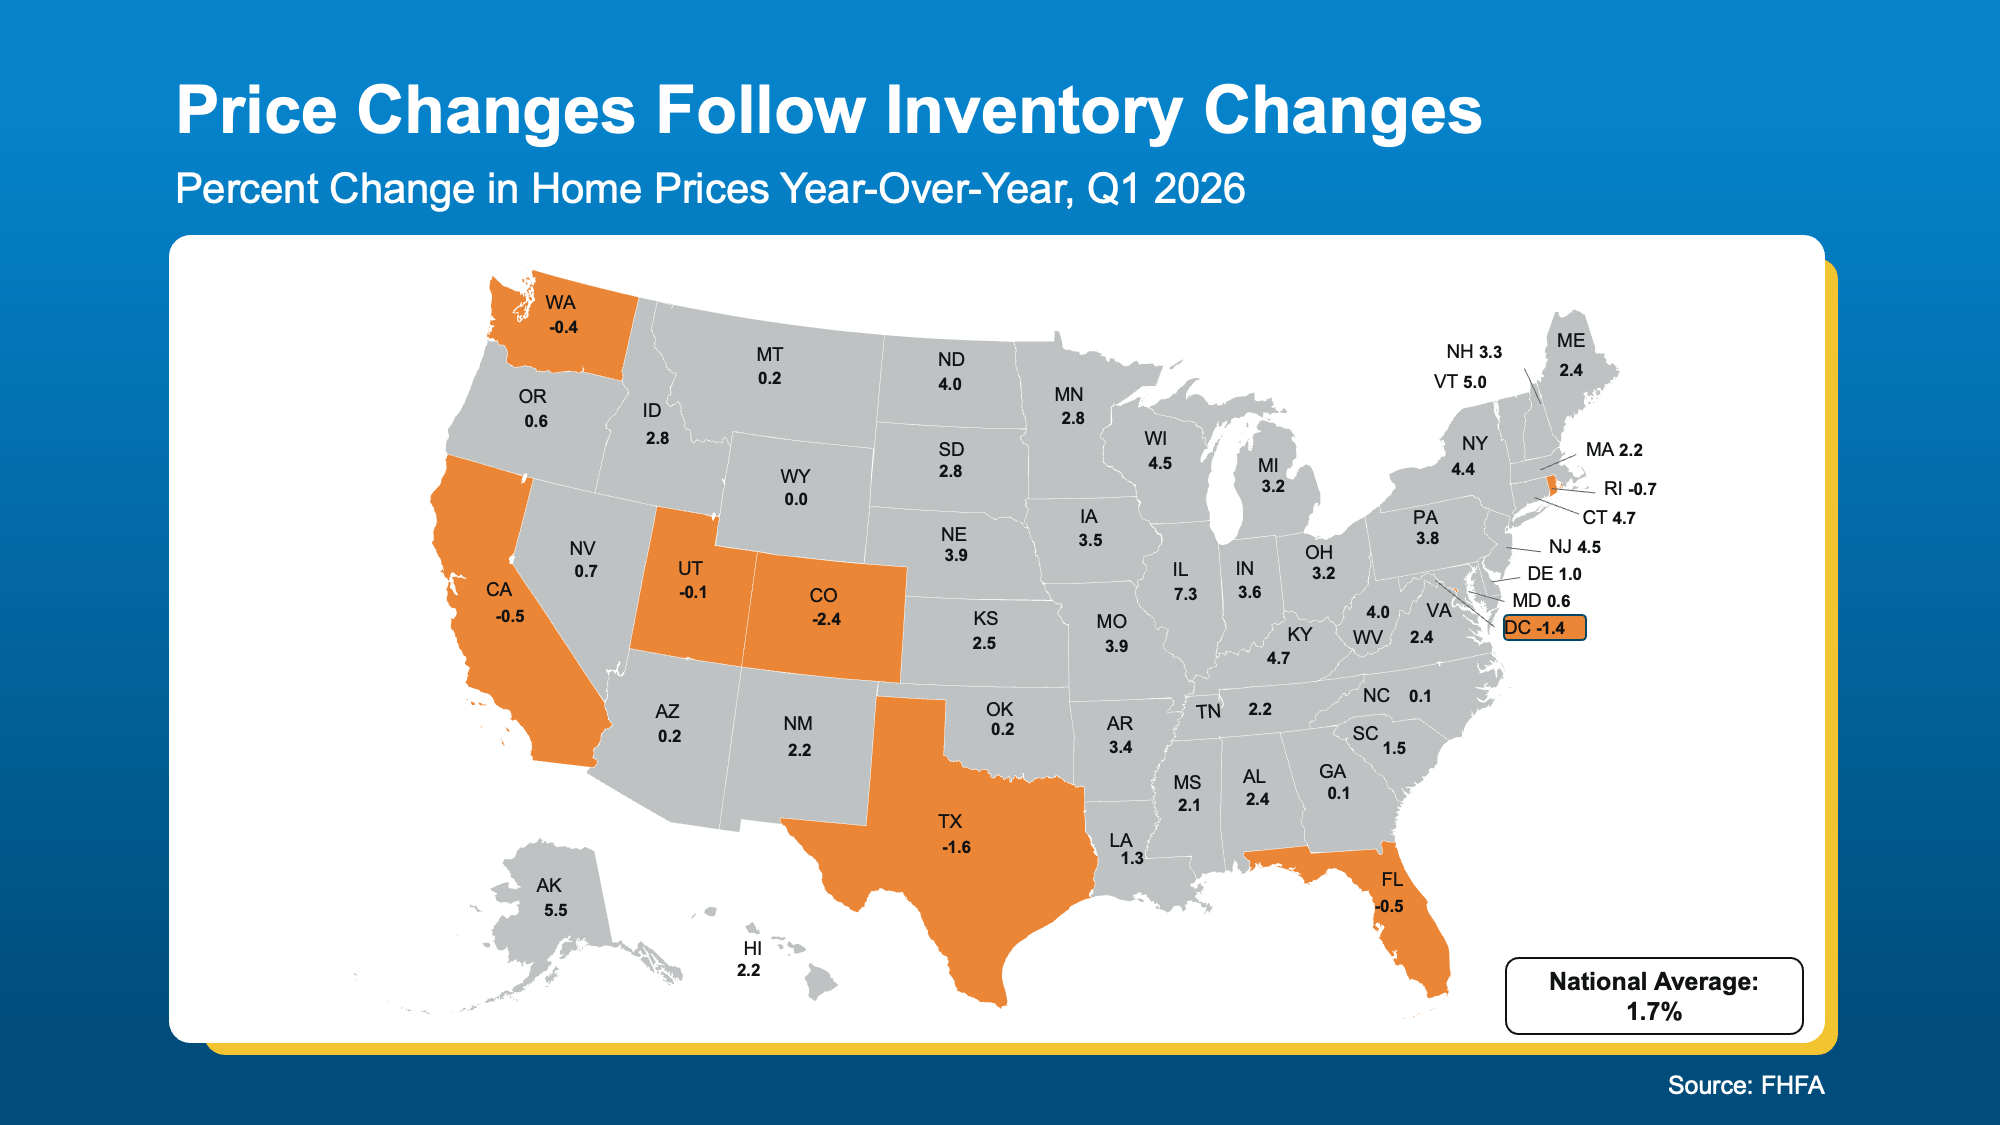
The national average of 1.7% price growth is accurate, but it’s an average of two very different stories happening at the same time – the few areas experiencing mild declines and the overwhelming majority that are still seeing prices rise. The connection between home prices and inventory explains this split perfectly.
What This Means If You’re Buying or Selling
If you’re a buyer, the market you’re shopping in matters a lot right now. In places like Texas, Colorado, or Florida, you may have real negotiating power – more choices, less competition, and sellers who are more motivated to make a deal. In tighter markets like much of the Northeast, you’re still likely facing a lot of competition.
If you’re a seller, pricing strategy is everything. In markets where inventory has risen, overpricing is one of the fastest ways to linger on the market and eventually sell for less than you would have with the right price from day one. In markets where inventory is still low, you’re in a strong spot, but getting your price right still matters if you want to attract serious buyers quickly. Either way, that’s where a local real estate agent earns their keep.
Your Local Market Is What Matters Most
National headlines about home prices and inventory don’t tell your story. Here’s what’s actually happening across the five counties we serve, based on the latest May 2026 closed-sales data.
Inventory is climbing across all of South Jersey, the same pattern showing up nationally. But here’s the key difference: in most of our counties, it hasn’t climbed enough to cool prices. That’s the Northeast dynamic Lambert described, where supply is recovering but still sits below the level that flattens pricing.
| County (May 2026) | Median Price | Price YoY | Inventory YoY | Days on Market |
|---|---|---|---|---|
| Camden | $380,000 | +7.0% | +21.3% | 14 |
| Burlington | $390,000 | Flat | +24.3% | 15 |
| Gloucester | $385,000 | +5.5% | +9.6% | 14 |
| Salem | $265,000 | +1.9% | +5.5% | 35 |
| Cumberland | $295,000 | +8.7% | +40.2% | 19 |
Look at the split. Cumberland County saw inventory surge 40.2% year over year, yet the median price still rose 8.7% to $295,000 and homes are selling faster than last year, 19 days versus 34. Camden County inventory rose 21.3% while prices climbed 7% to $380,000. Gloucester County added 9.6% more inventory and prices still gained 5.5% to $385,000. In each case, more homes came to market, but prices held firm because supply is still catching up to demand.
Two counties tell a different part of the story. Burlington County saw inventory grow 24.3%, and its median price held flat at $390,000, the closest thing locally to the flattening you see in Texas or Florida. Salem County, our smallest and most rural market, saw days on market more than double from 15 to 35, and the share of homes selling over asking dropped from 61.3% to 43.1%, so buyers there have real room to negotiate.
The one thing every county shares: fewer homes selling over the asking price than a year ago. Camden slipped to 53.3% from 59.2%, Burlington to 48.8% from 57.3%, and the same softening shows up in every county we cover. Even where prices are still rising, the frantic bidding wars have eased. For buyers that means more breathing room. For sellers it means pricing right from day one matters more than it did a year ago.
Understanding the inventory situation in your specific county is the single most important factor in making a smart move. Whether you’re timing your sale or shaping your offer, local data beats national trends every time.
Bottom Line
When it comes to prices, where you are matters more than ever right now. A local real estate agent is the best person to help you make sense of it.
If you want to talk through what this means for your situation, schedule a quick call and we’ll walk through it together.
For the full picture in your county, see our county market reports for Camden, Burlington, Gloucester, Salem, and Cumberland counties.