By Mike Lentz | The Mike Lentz Team – Keller Williams Realty
National headlines average together hundreds of markets that are moving in different directions. Nationally, asking prices fell about 3 percent this fall. In South Jersey, the median asking price on new listings barely moved and sits about 4 percent above last fall. Your county tells you more than any national number.
If you own a home or you’re looking to buy one, you probably pay attention to home price news. Making sense of the headlines is harder than it should be.
One says prices are falling. The next says they’re still climbing.
Both can be accurate for the place they measure. Neither one measures Gloucester, Camden, Burlington, Salem, or Cumberland County. So we pulled the local numbers.
Why You’re Confused by Home Price Headlines: The Asking Price Story
The headline driving much of the confusion this fall is about asking prices. According to HousingWire Data, the national median asking price dropped from $449,000 in early August to $435,000 two months later, a decline of about 3 percent. Asking prices cool every fall once the summer buyers are gone, so most of that drop is seasonal.
South Jersey asking prices did not follow the national line. We tracked the median asking price of every newly listed home across our five counties, week by week, over the same stretch:
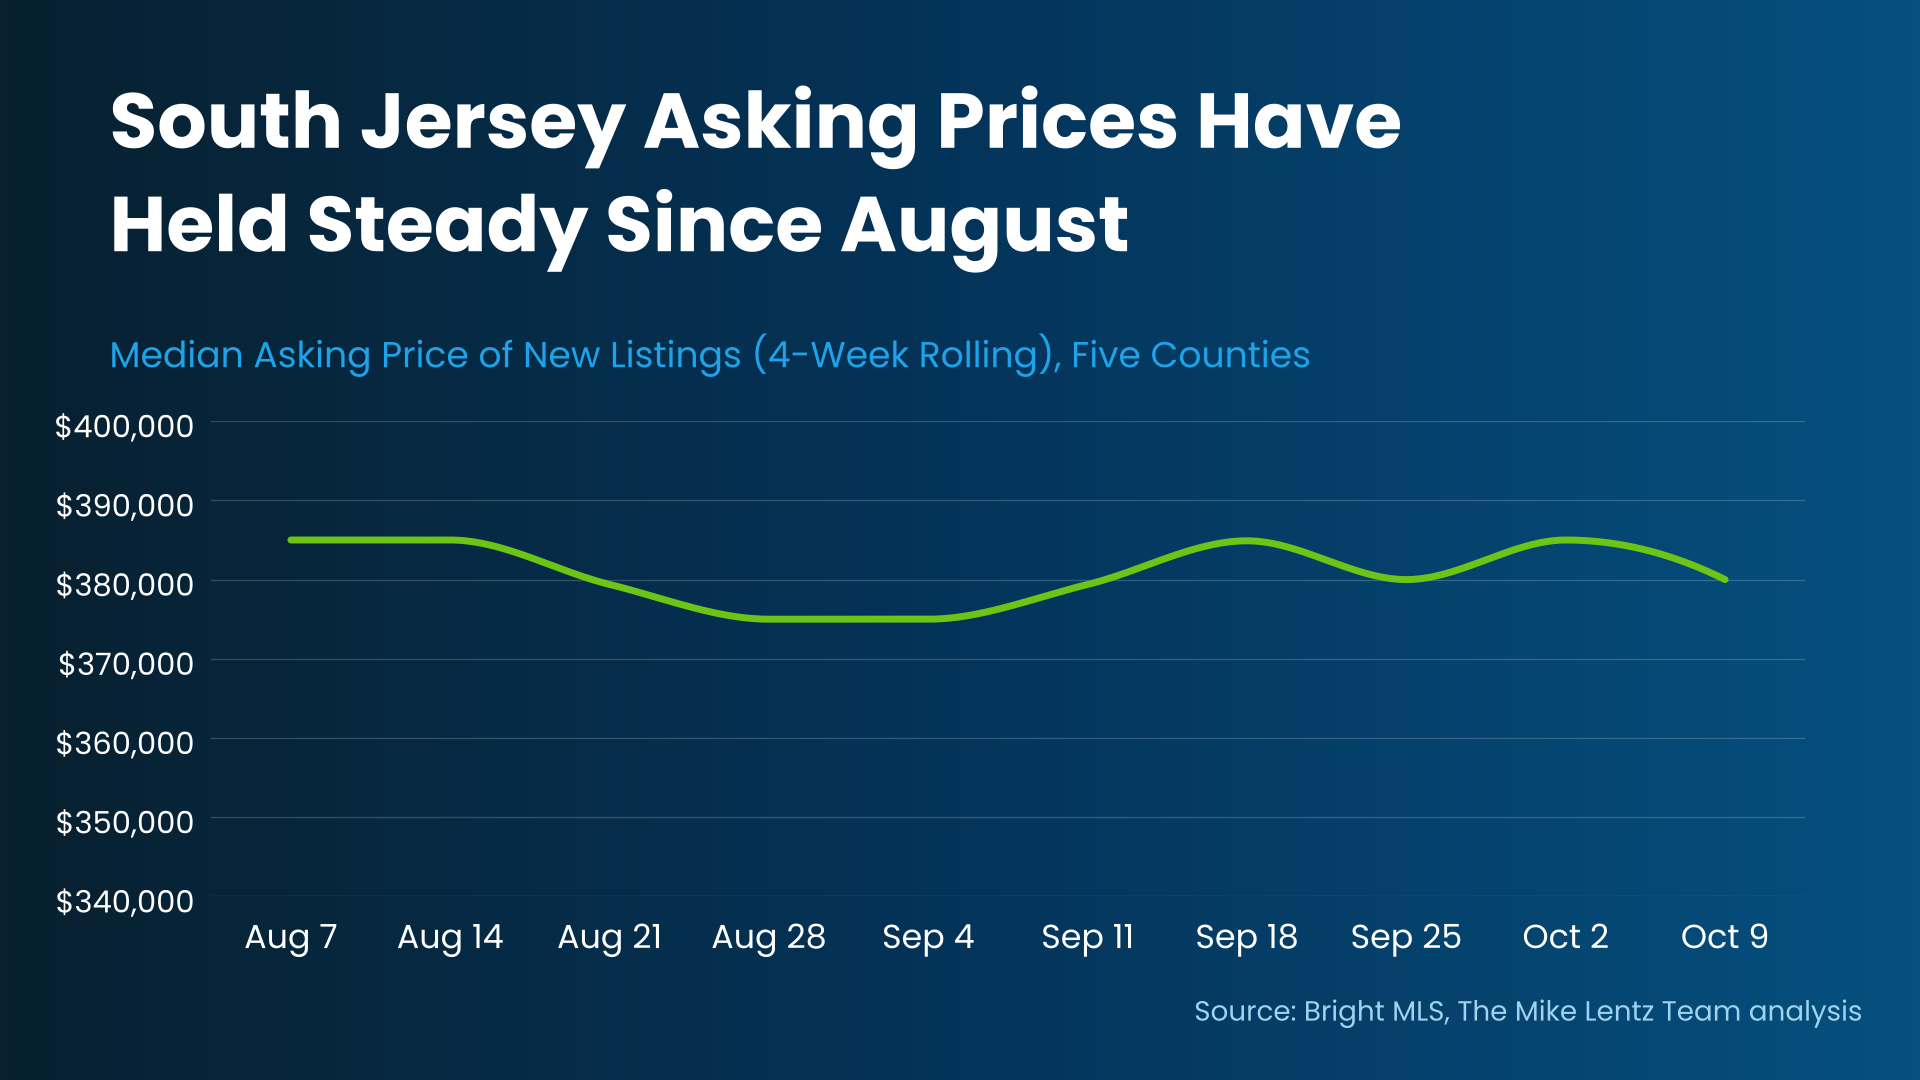
The four-week median started August at $385,000 and stood at $380,000 on October 9. It never left the range of $375,000 to $385,000. That is a change of about 1 percent, a third of the national decline.
Last year, the same weeks ran from $375,000 down to $365,000. So South Jersey sellers did trim asking prices a little in the fall of 2025, and less so this year. Compared to last October, the median asking price on new listings is up about 4 percent.
More Homes for Sale, but Far Fewer Than in 2019
Nationally, more homes are on the market than at any time since November 2019, and that extra supply is part of why asking prices eased. South Jersey’s supply is rising too, but from a much lower starting point.
In Burlington, Camden, Gloucester, and Salem counties, 3,757 homes were listed for sale or coming soon in mid-October. That is 16 percent more than the 3,227 a year earlier, but still 41 percent fewer than the 6,391 in mid-October 2019. (Cumberland County is left out of these figures because our weekly count for it starts in 2023.)
Buyers have more homes to choose from than last fall, but sellers here face far less competition than the national numbers suggest. That helps explain why South Jersey asking prices held while national ones slipped. If you want to understand how to price your home, start with what is selling in your county.
Where You Live Changes Everything When You’re Confused by Home Price Headlines
Realtor.com explains:
“While national headlines might suggest a buyer’s market is taking hold, the reality on the ground depends heavily on where and what you’re trying to buy. Local trends can diverge sharply from national averages, especially when you factor in price range, property type, and post-pandemic market dynamics.”
That holds inside South Jersey, too. Here is the median sale price for homes that actually closed from January through September in each county, this year against last year:
| County | Median Sale Price 2025 (Jan-Sep) | Median Sale Price 2026 (Jan-Sep) | Change |
|---|---|---|---|
| Gloucester | $360,000 | $379,000 | +5.3% |
| Salem | $267,500 | $279,000 | +4.3% |
| Camden | $355,000 | $370,000 | +4.2% |
| Cumberland | $270,000 | $280,000 | +3.7% |
| Burlington | $399,990 | $403,000 | +0.8% |
| All five counties | $360,000 | $374,000 | +3.9% |
Source: Bright MLS closed sales, The Mike Lentz Team analysis.
What This Means for Gloucester, Camden, Burlington, Salem, and Cumberland Counties
Gloucester County prices rose more than 5 percent. Burlington County, right next door, barely moved. That is a gap of 4.5 percentage points inside our own service area, between counties a short drive apart.
The gap changes the game plan. A Gloucester County seller is pricing into a market that is still climbing, so there may be no reason to cut the price early. A Burlington County seller has less room above last year’s numbers and needs to price close to recent sales from the start. A buyer looking in Burlington may find more room to negotiate than one shopping in Gloucester.
Even the county level is broad. Prices move differently by town, price range, and property type within each county. We track what is actually selling, not what is listed or what happened six months ago. When you’re confused by home price headlines, that local data is the number to trust.
Why a Crash Isn’t Coming
If national reports of falling prices have you worried about a bigger crash, start with the local record. None of our five counties has a lower median sale price this year than last year.
Look further back and the pattern holds. The five-county median sale price for January through September was $174,900 in 2018. It has risen every year since and reached $374,000 in 2026. That is more than double in eight years, and it held up through 2022 and 2023, when mortgage rates jumped.
The national long-term record says the same thing. The Federal Housing Finance Agency (FHFA) reports that national prices have grown year over year every quarter since 2012. Going back further, a $100,000 home bought in 1991 would be worth about $436,000 today, even with the 2008 crash factored in:
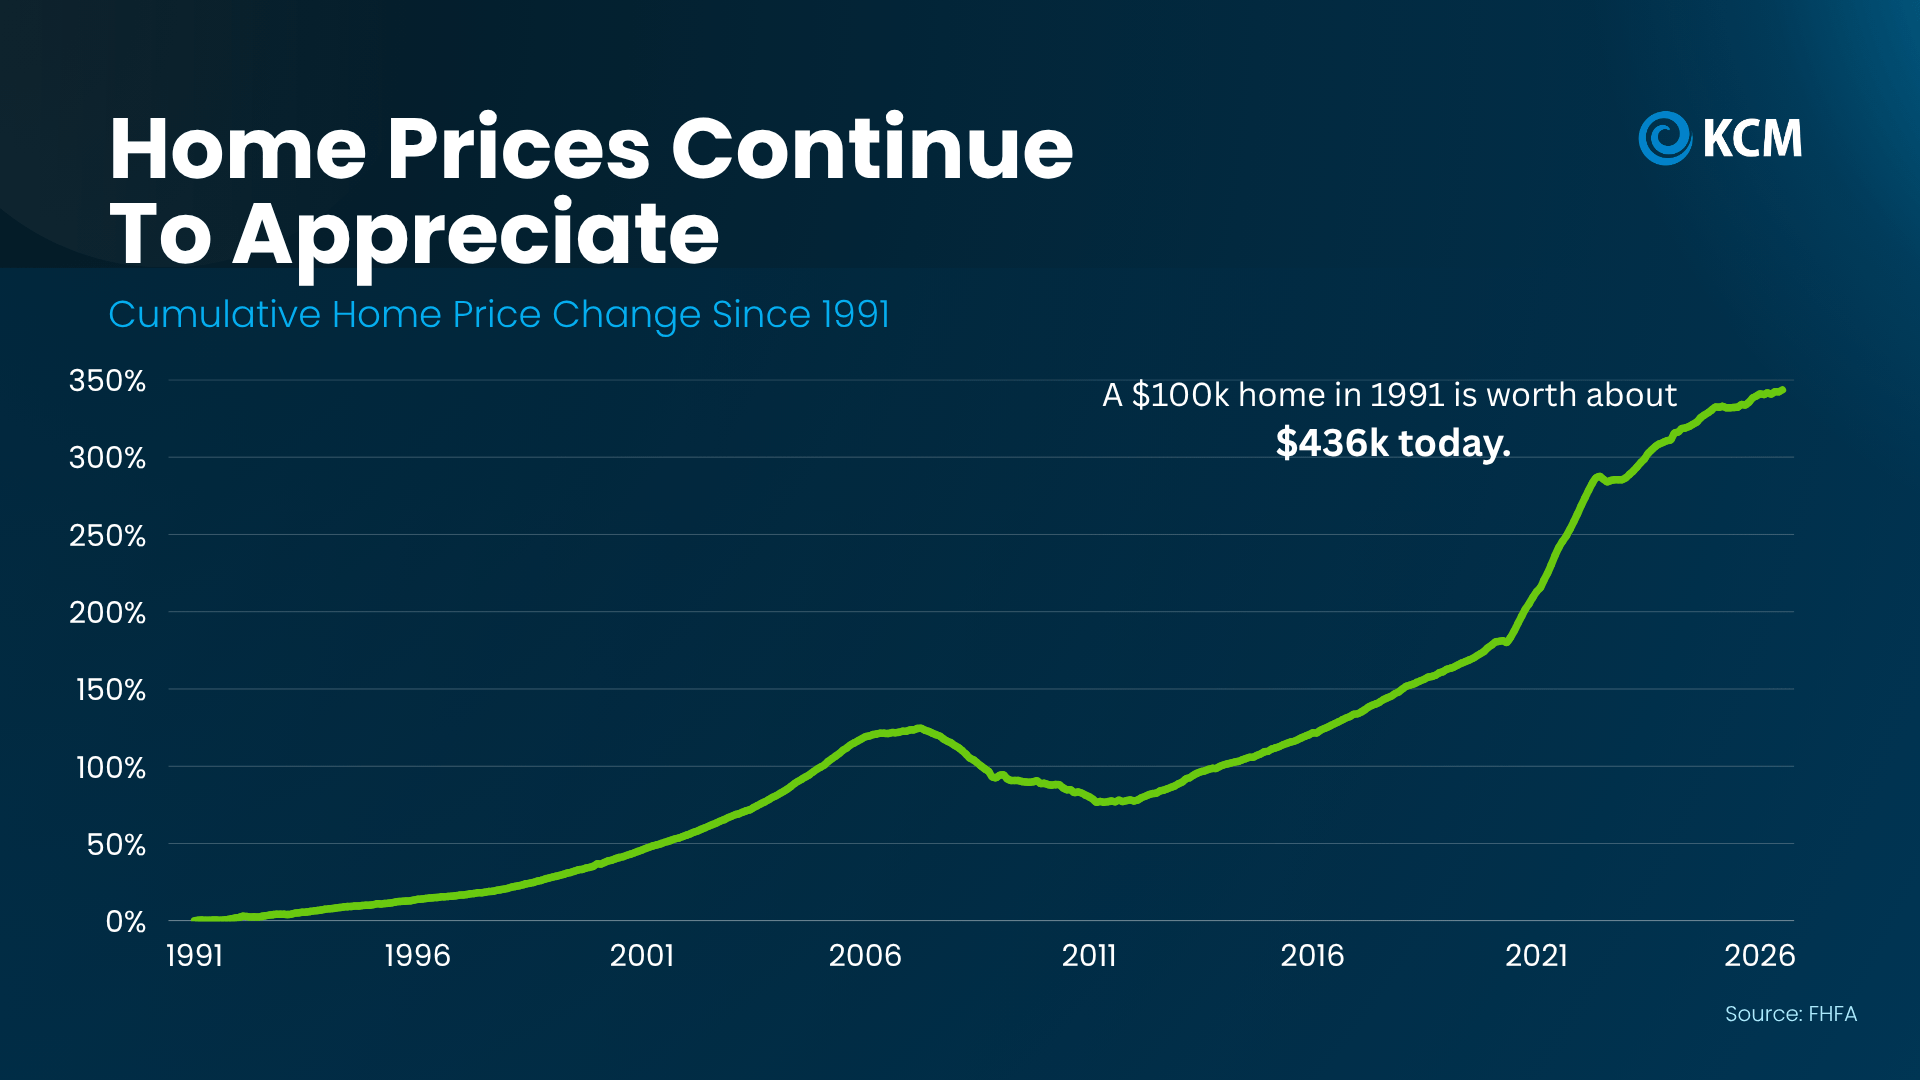
The markets with small declines right now are mostly ones that overheated during the pandemic. South Jersey prices are still rising, at a slower and steadier pace than in 2021 and 2022. Over time, home values here have a strong track record.
Stop Reading National Headlines, Start Looking at Local Data
National headlines can’t tell you what your home is worth or how much room you have to negotiate. Local data can. If you’re thinking about buying or selling, we can show you how prices are moving in your county and your town, so you can set your price or make your offer with confidence. You don’t need to be confused by home price headlines when you have accurate local information.
October’s closed sales will be final in early November, and we will update the county reports when they are.
If you want to talk through what this means for your situation, schedule a quick call and we’ll walk through it together.
For the full picture in your county, see our county market reports for Camden, Burlington, Gloucester, Salem, and Cumberland counties.