By Mike Lentz | The Mike Lentz Team - Keller Williams Realty
Yes, but it has not stopped. In our five South Jersey counties, active and coming soon listings averaged 3,983 in July 2026, up 14.7% from a year earlier. That is real growth, but it is well off the 22.4% pace we measured in July 2025. Buyers have more to choose from than last summer, and the pile is growing more slowly.
You may have heard the number of homes for sale isn’t growing like it was. And maybe that has you worried you won’t find a home you love when it’s time to make your move. Housing inventory growth is the number that answers that worry, and the national figure and the South Jersey figure are nowhere close to each other right now.
The national headlines are only half the story. Below is what the national data says, and then what our own weekly count of listings in Camden, Burlington, Gloucester, Salem, and Cumberland counties actually shows. The two do not line up as neatly as you might expect.
The National Picture: Housing Inventory Growth Has Slowed, But It Hasn’t Stopped
Everything in this section comes from national data, not from South Jersey.
Nationally, active listings were up 2.1% year-over-year in July, according to Realtor.com. Back in January, national inventory was up 10%. And in May of 2025, it was up 31.5%. So national housing inventory growth has cooled off a lot over the last year.
The past 3 months, though, have all seen national inventory growth land in roughly the same range, which is a sign this slowdown may be nearing its floor:
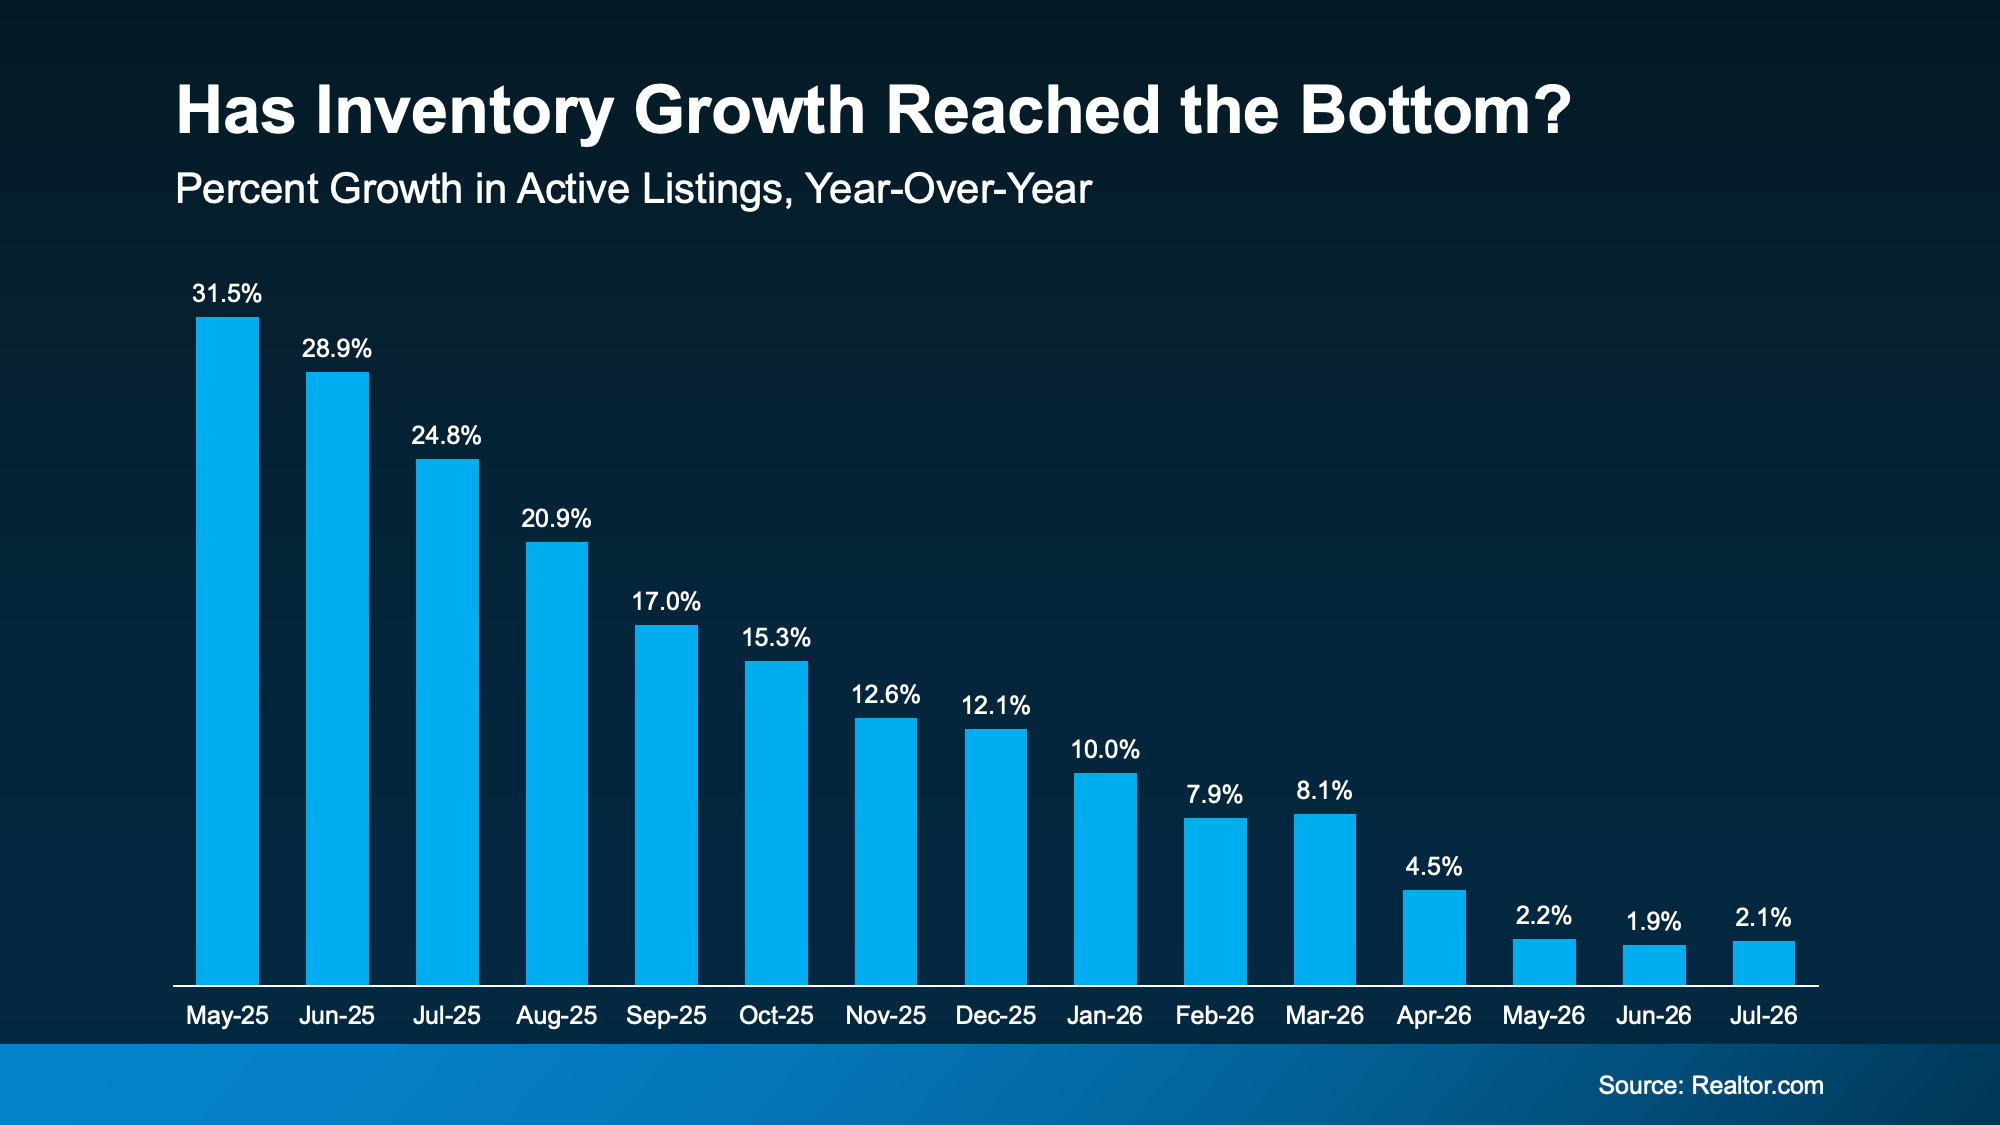
Every one of those bars shows a period where inventory grew. Homes are still coming onto the market. The pace has just moderated.
Nationally, This Was the Best July for Inventory Since 2019
Again, national figures. Compared to the rock-bottom lows of 2021, national inventory has climbed back substantially. The number of homes for sale nationwide has been up year-over-year for 33 straight months, and inventory has almost doubled in just a few years.
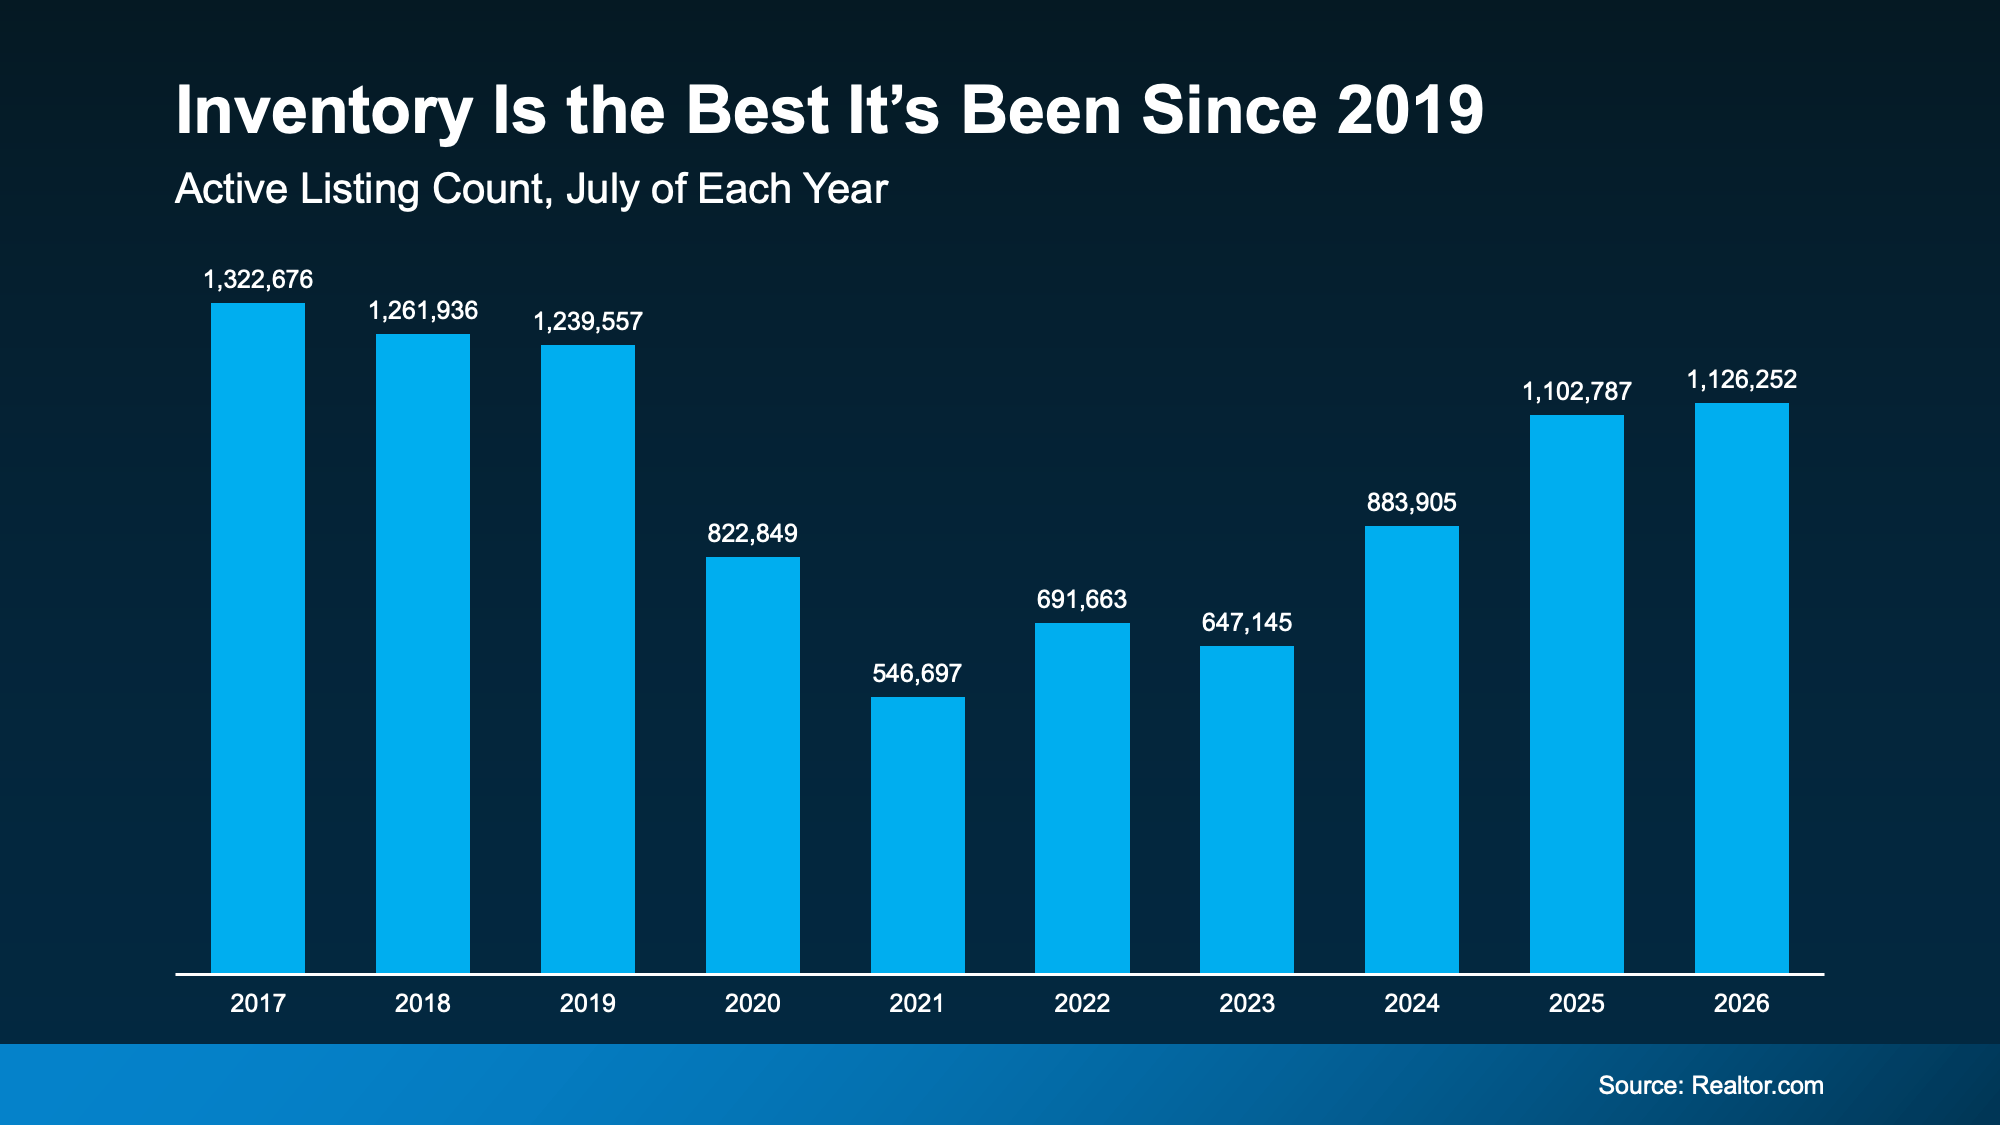
The national market still needs about 150k listings to get back to pre-pandemic levels, and some economists think national housing inventory growth could carry the country back to 2019 levels by the end of this year. Hold that thought, because South Jersey is not close to that mark.
Why Higher Rates May Actually Help Inventory Grow
It works like this. When mortgage rates climb, inventory tends to climb with them. As Mike Simonsen, Chief Economist at Compass, explains:
“When rates rise; inventory rises. When rates fall; inventory falls. So, from July last year to March this year, rates ease lower and all the inventory growth of the past several years evaporated. If rates move higher from here or stay elevated for [a] longer period of time, then we should expect supply to build again.”
Rates are expected to hold in the mid-to-upper 6% range for a while longer, and Realtor.com‘s latest national forecast has inventory ending 2026 up 3.6% year-over-year.
South Jersey Housing Inventory Growth, Counted Every Week
We have counted active and coming soon listings in each of our counties every week since 2018. Cumberland County joined the count in March 2023. Nobody has to wait for a national report to tell us what happened here, because we already wrote it down.
Here is July 2026 against July 2025, using the monthly average of those weekly counts. July is the most recent full month.
| County | July 2025 | July 2026 | Change | Year before that |
|---|---|---|---|---|
| Burlington | 1,114 | 1,305 | +17.1% | +24.2% |
| Camden | 1,075 | 1,254 | +16.7% | +30.9% |
| Gloucester | 658 | 749 | +13.8% | +8.2% |
| Cumberland | 404 | 428 | +5.9% | +28.3% |
| Salem | 222 | 247 | +11.3% | +12.7% |
| Five counties | 3,473 | 3,983 | +14.7% | +22.4% |
Two things jump out.
First, the slowdown is real here, and it is much bigger than the national 2.1% figure suggests in either direction. South Jersey housing inventory growth is running roughly seven times the national rate. But our own pace has fallen by about a third, from 22.4% to 14.7%, in twelve months.
Second, the slowdown is not evenly spread. Cumberland County went from adding inventory at 28.3% a year to 5.9%, which is close to flat. Gloucester County did the opposite and sped up, from 8.2% to 13.8%. If you are shopping in Washington Township or Woolwich, the choice you have this summer is meaningfully wider than it was last summer. If you are shopping in Vineland or Millville, it is about the same.
South Jersey Is Nowhere Near 2019 Levels
This is where the national story and the local one part ways, and it matters a lot if you are a buyer.
The week of August 16, 2026, we counted 4,105 active and coming soon listings across the five counties. That is the highest weekly reading since we started tracking all five together in March 2023. It sounds like a lot, and compared to the last three years it is.
Now go back further. For the four counties we have tracked since 2018, that same August week showed 3,674 listings this year against 6,833 in August 2019. We are still running about 46% below where this market sat before the pandemic.
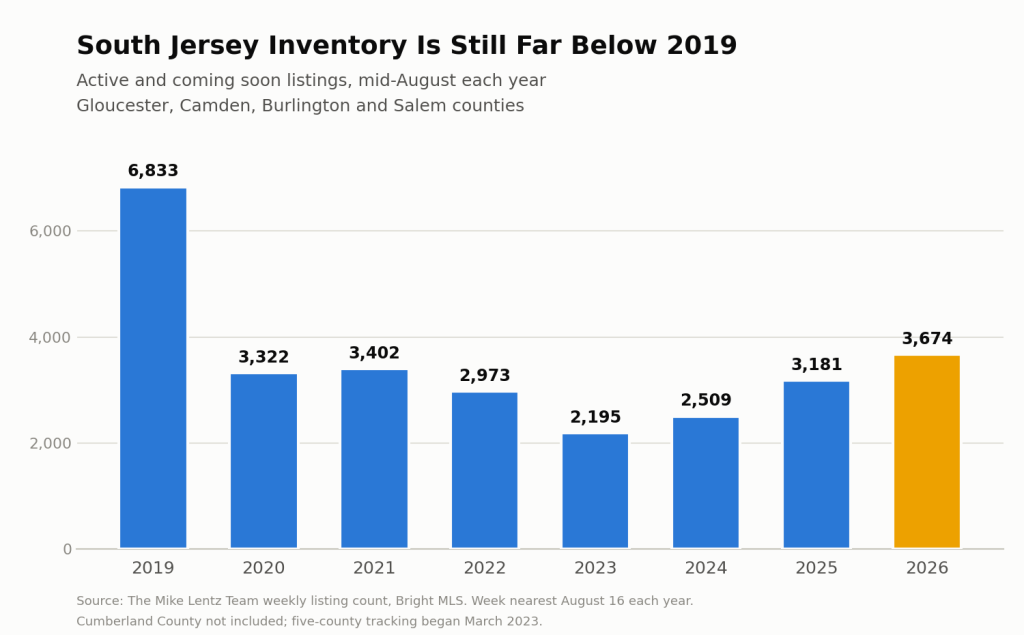
So when you read that the country is closing in on 2019 inventory levels, understand that South Jersey is not part of that. We have recovered from the 2021 bottom, but we have recovered maybe halfway. That is the practical reason a well-priced house in Haddonfield or Moorestown still moves quickly even in a summer with more listings than we have seen in years.
What Housing Inventory Growth Means If You Are Buying
You have more to work with than you did in 2023, when the five-county count sat near 2,464 in mid-August. You do not have the wide-open market some national coverage implies.
Practically, that means the extra inventory shows up as breathing room rather than as leverage. You will get to see a few more houses before deciding. You will less often be asked to waive an inspection. But in the popular price bands and school districts, you are still competing.
If you are wondering whether this shifts the balance between buyers and sellers, the answer is a little, and it depends heavily on your county and price range.
What This Means If You Are Selling
Burlington and Camden counties both added roughly 180 to 190 listings compared to last July. Your house has more company on the market than it did a year ago, and buyers have more to compare it against. Pricing that would have worked in 2024 will sit now.
That is not a reason to wait. Inventory here has climbed every year since 2023, and the forecast is for it to keep climbing. Competing against 1,305 listings in Burlington County today is easier than competing against whatever the number is next summer.
The Bottom Line
Nationally, housing inventory growth has slowed to a crawl and the country is approaching 2019 levels. In South Jersey, it has slowed from very fast to merely fast, and we are still 46% short of 2019. Those are two different markets, and only one of them is the one you are buying or selling in.
The number that matters is the count in your county, in your price range, this month. That is the number we track. If you want to talk through what it means for your situation, schedule a quick call and we’ll walk through it together.
For the full picture in your county, see our county market reports for Camden, Burlington, Gloucester, Salem, and Cumberland counties.